Year-end is the single best moment to close that gap. W-2s are going out, annual reviews are happening, and employees are naturally re-evaluating where they stand. A well-constructed year-end compensation report turns that moment into a retention tool.
This guide walks through a real example of what a year-end compensation report looks like, when to distribute it, and how to create one — without hiring a consultant or spending weeks on it.
Key Takeaways
- Shows total employer investment for the completed year: salary, taxes, benefits, and perks
- Best timed for January through early February, alongside W-2s and annual reviews
- Covers direct pay, employer taxes, retirement matches, health premiums, PTO value, and non-cash benefits
- Self-service tools can build personalized reports for a full employee census in hours
- Full compensation visibility raises pay-value awareness and supports retention
What Is a Year-End Compensation Report?
A year-end compensation report is a personalized document given to each employee at the close of the calendar year. It summarizes every dollar the employer spent on that individual's compensation during the prior 12 months: not just gross wages, but every form of direct and indirect pay made on their behalf.
How It Differs from a Pay Stub
A pay stub only captures earnings and deductions for a single pay period. It shows the employee's share of benefit deductions but never reflects what the employer contributed.
A year-end compensation report works differently:
- Uses actual, verified figures from the completed year — not projections
- Includes employer-paid costs that never appear on any paycheck (health premiums, payroll taxes, 401(k) match)
- Aggregates all compensation across all 12 months into one clear document
- Presents total employer investment alongside gross wages
The California Employers Association describes this document as a "total rewards or total benefits statement": a complete picture of what an employee earns, not just what they're paid.
Why It Matters for Both Sides
For employees, the report delivers transparency. Many have no idea their employer is contributing $7,000+ annually toward their health insurance alone. Seeing that number in writing often changes how they value the full package.
For employers, the report is a retention and trust-building tool. It demonstrates the actual investment made in each person: concrete evidence that extends past base salary alone.
What Does a Year-End Compensation Report Example Look Like?
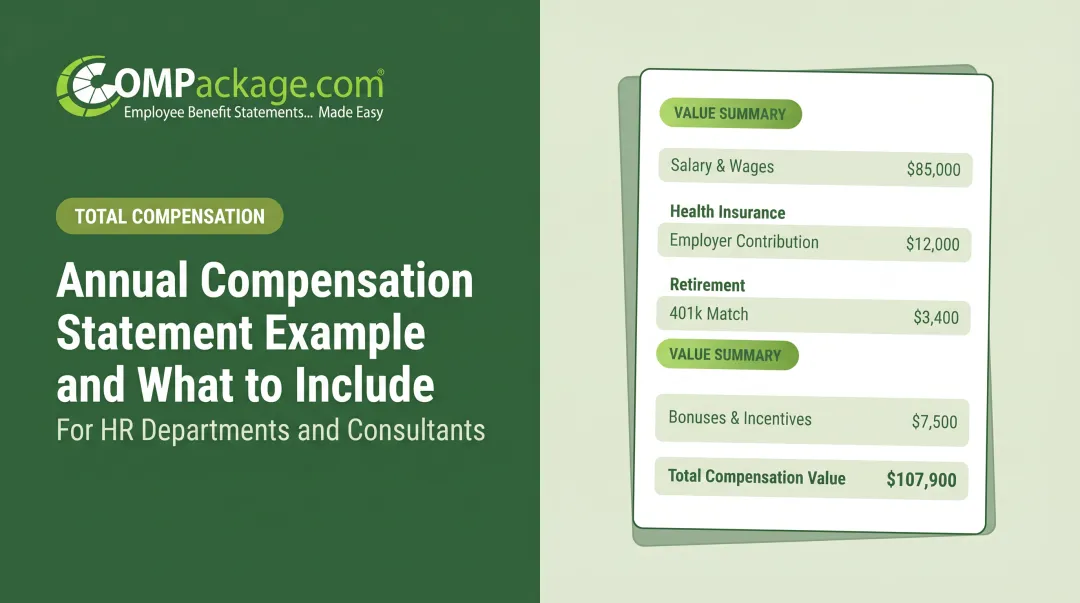
A well-built report follows a consistent structure. Here's how a real example breaks down, section by section.
Opening Section: Employee Identification
The report opens with the employee's full name, job title, department, and the reporting period (January 1 – December 31, [Year]). That personalization signals the document was built for this person, not mass-distributed. Employees take what follows more seriously when it feels specific to them.
Direct Compensation
This section pulls from payroll records and shows exactly what the employee earned:
- Base salary or gross wages for the year (e.g., $56,000)
- Performance bonus or incentives paid during the year (e.g., $1,786)
- Overtime pay or commissions, if applicable
These figures come directly from finalized payroll data, not estimates. One COMPackage sample report shows $56,000 in base pay and $1,786 in performance bonus as the direct compensation lines.
Employer-Paid Benefits
This is where most employees are genuinely surprised. The employer-paid benefits section itemizes costs they never see on a pay stub:
- Health, dental, and vision insurance: KFF's 2025 Employer Health Benefits Survey puts average employer contributions at $7,885 single and $20,143 family
- 401(k) match or retirement contributions
- Life insurance and disability coverage premiums
- Workers' compensation costs allocated to that employee
- Employer payroll taxes: Social Security (6.2% up to $176,100) and Medicare (1.45%), per IRS Publication 15
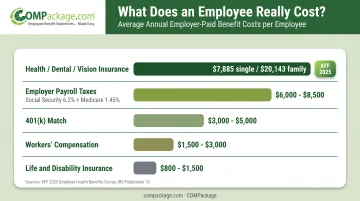
The COMPackage sample report cited above shows $32,138 in company-paid benefits, or 60.58% additional value beyond base salary. That figure is usually the report's most powerful data point.
Indirect and Non-Cash Compensation
Beyond insurance and taxes, this section captures the benefits that add real dollar value but rarely get acknowledged:
- Paid time off accrued and used (valued at the employee's hourly rate)
- Cell phone or vehicle allowances
- Professional development, tuition support, or training costs
- Wellness program contributions
- Workplace perks such as free parking or subsidized meals
Even modest perks compound quickly. A $50/month cell phone allowance, free parking, and a $500 training budget add $1,700+ a year—none of which most employees count in "what I make."
Summary Section and Visual
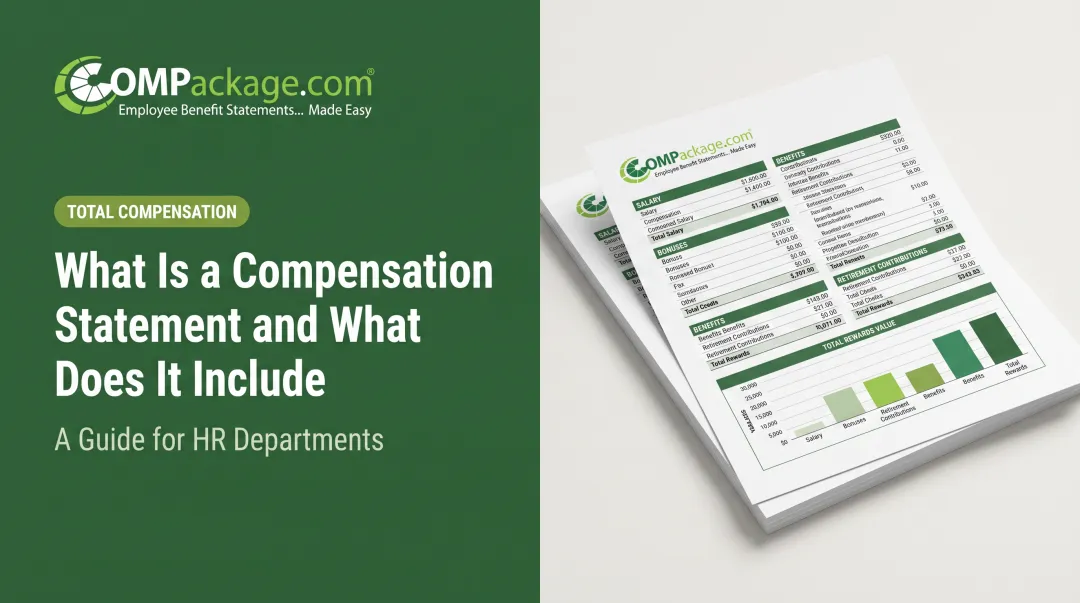
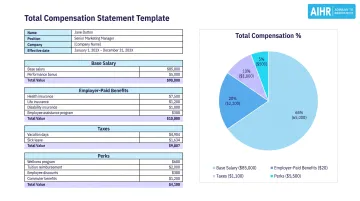
The final section presents a total compensation figure that aggregates every category above. Effective reports pair this number with a pie chart or bar graph showing the breakdown by category.
That visual is what makes the report memorable. The gap between "my salary" and "what my employer actually spends on me" becomes immediately visible, and often surprising.
When Should You Distribute a Year-End Compensation Report?
Timing determines how much impact the report has. Get it right, and it lands during a moment when employees are already paying attention.
The Primary Window: January–Early February
After payroll for the prior year is finalized and before the W-2 deadline, distribute compensation reports. For 2025 wages, the IRS required employee W-2 copies by February 2, 2026.
Pairing the compensation report with W-2 distribution ties it to a concrete financial moment employees are already tracking. This window also overlaps with annual performance review cycles at many companies and the stretch right after open enrollment, when employees have just made benefits decisions and are weighing their overall package.
Early Distribution: November–December
Some situations call for distributing ahead of year-end:
- Upcoming salary negotiations or budget discussions
- Recent turnover to address before January
- Pre-Q1 messaging that reinforces total pay before recruiter season
The tradeoff is that November reports use projected figures rather than finalized payroll data. If accuracy matters (and it should), the January window is preferable.
How to Create and Distribute Your Year-End Compensation Report
Step 1: Gather Source Data
Pull actual figures from finalized records. Estimates undermine credibility.
- Payroll records: Annual gross wages, bonuses, overtime
- Benefits carriers: Employer premium contributions for health, dental, vision, life, and disability
- Retirement plan records: Actual 401(k) match or employer contributions for the year
- Payroll tax records: Employer Social Security, Medicare, and unemployment insurance amounts
- Workers' compensation: Allocated cost per employee if tracked
Data gathering is the most time-consuming step. Build a simple collection checklist first so every source is ready before you enter a single figure.
Step 2: Choose Your Reporting Tool
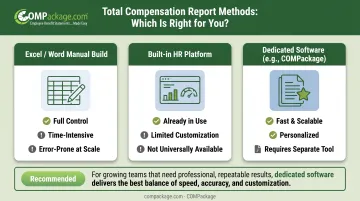
Three realistic options:
| Method | Pros | Cons |
|---|---|---|
| Excel/Word manual build | Full control | Time-intensive; error-prone at scale |
| Built-in HR platform feature | Already in use | Often limited customization; not all platforms include it |
| Dedicated compensation report software | Fast, scalable, personalized | Requires a separate tool |
COMPackage covers the third option as a self-service platform. You import employee data with an Excel bulk upload through the Employee LOADER, then generate personalized reports for a full census in under 90 minutes when your data is clean and prepared.
Built-in tools include:
- 80+ preprogrammed benefit categories
- Automated calculators for payroll taxes, 401(k), time-off, and insurance
- Employee-specific line items so each report only shows applicable benefits
No consultant is required. Plans start at $149/year for companies with up to 5 employees.
Step 3: Build Individual Reports
When generating reports, verify:
- Only benefits applicable to that employee appear (a single employee's report should not show family health insurance rates)
- Dollar figures match source records exactly
- Company logo and branding are included for a professional presentation
- The salutation field includes a year-end message or acknowledgment
Step 4: Plan Your Delivery Method
- Printed reports distributed during a one-on-one or team meeting carry higher perceived value and create a natural opportunity for conversation
- Digital delivery via secure email or printed PDF is faster and more practical for larger teams
Choose based on workforce size and culture. A 15-person company can reasonably sit down with each employee; a 200-person organization probably can't.
Step 5: Present and Explain the Report
Distributing without context is a missed opportunity. Managers or HR should walk each employee through the report and invite questions on specific line items.
Focus the conversation on:
- The total compensation figure at the bottom
- Employer-paid benefits the employee may undervalue
- Any line items that look unfamiliar
A focused 10-minute discussion at handoff does more to reset how employees view their pay than the document alone.
Best Practices to Make Your Year-End Compensation Report Work
Personalize every report. Include the employee's name, tenure, and their specific benefit elections. A generic template handed to the whole team signals low effort. A tailored document shows it was built for them, and that changes how they receive it.
Lead with the visual. The BLS Employment Cost data shows benefits represent nearly 30% of total private-sector compensation, yet employees estimate just 16%. A pie chart that shows their salary next to employer-paid benefits makes this gap tangible in seconds. Without the visual, most employees will skim the numbers and miss the point.
Build in follow-up. Employees will have questions about insurance line items, tax contributions, or how certain perks were valued. Invite those conversations up front. An open-door policy on compensation questions builds trust and prevents misinformation from filling the gaps.
Keep reports accurate and current. COMPackage lets you update reports throughout the year at no additional charge, so mid-year changes (new hires, benefit adjustments, raises) show up without waiting for the next annual cycle.
Frequently Asked Questions
What is a year-end compensation report?
A year-end compensation report is a personalized annual document showing an employee the total value of their compensation (salary, employer-paid benefits, payroll taxes, and perks) using actual figures from the completed calendar year, not projections. It goes well beyond what appears on any pay stub.
What should be included in a year-end compensation report?
Key categories include gross wages, bonuses, employer health/dental/vision premium contributions, 401(k) match, employer-paid Social Security and Medicare taxes, paid time off value, and any role-specific allowances or perks. Only items with a verifiable dollar value should be included in the total.
When is the best time to distribute a year-end compensation report?
January through early February (after payroll is finalized and near W-2 distribution) is the most effective window. Some employers distribute in November or December when they want to reinforce retention messaging before annual reviews or the start of recruiting season.
How is a year-end compensation report different from a pay stub?
A pay stub shows per-paycheck earnings and deductions for a single pay period. A year-end compensation report aggregates all employer-paid costs across the full year and includes benefits that never appear on a pay stub: insurance premiums, retirement contributions, and employer payroll taxes.
Can small businesses create their own year-end compensation reports?
Absolutely. Tools like COMPackage are built specifically for companies of all sizes, with plans starting at $149/year for up to 5 employees. Reports for an entire small-business census can typically be completed in a few hours using the bulk Excel upload feature, with no consultant required.
What is a reasonable year-end bonus?
Bonus amounts vary widely by industry, role, and company size. BLS data puts nonproduction bonuses at about 2.9% of private-sector compensation cost. Include the actual amount as a line item so employees see it as part of their total package.