So which sector actually wins? It depends entirely on what you're measuring, which level of government you're examining, and what matters most to the individual employee.
This guide breaks down both sectors across salary, benefits, job security, and career advancement — with practical guidance for employees weighing their options and private employers trying to compete.
Key Takeaways
- State and local government workers average $66.41/hour in total compensation vs. $46.60 in private industry
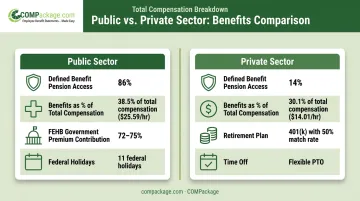
- Benefits are the biggest gap: government benefits represent 38.5% of total compensation vs. 30.1% in the private sector
- Federal employees earn 10% less in wages than comparable private sector workers, though their benefits run 43% higher
- Higher-credentialed workers typically fare better in the private sector; the compensation advantage shifts significantly by education level
- Private employers who communicate total compensation clearly can reduce turnover driven by employees undervaluing their own packages
Public vs. Private Sector Compensation: Quick Comparison
Here's how public and private sector compensation compare across the dimensions that matter most to employees and employers alike.
| Dimension | Public Sector | Private Sector |
|---|---|---|
| Base Salary | Structured pay scales (e.g., GS schedule); capped by grade/step system | Market-driven; higher ceiling potential, especially in tech and finance |
| Benefits Package | Defined benefit pensions, FEHB health coverage, guaranteed paid leave | 401(k) with employer match, variable health plans, flexible PTO |
| Job Security | Strong protections; termination requires formal process and cause | Generally at-will employment; less formal protection |
| Career Advancement | Seniority-based with predefined promotion criteria | Performance-driven; faster upward mobility possible |
| Work-Life Balance | Set hours, 11 federal holidays, separate sick/vacation accrual | Varies widely by employer; more flexible arrangements increasingly common |
What Is Public Sector Compensation?
Public sector jobs are funded by taxpayer dollars across three tiers: federal, state, and local government. Think public school teachers, law enforcement officers, social workers, and federal agency staff.
Pay in this sector is governed by standardized scales, legislative budgets, and civil service regulations — not market forces alone. That structural difference shapes everything from base salary to retirement benefits.
The Federal Pay Structure
The federal General Schedule (GS) system covers the majority of civilian white-collar federal employees. It runs from GS-1 through GS-15, with each grade containing 10 step rates. Each step equals roughly 3% of salary, and moving from Step 1 to Step 10 within a single grade typically takes 18 years of service.
A GS-15 — the highest standard federal grade — ranges from $123,041 at Step 1 to $159,950 at Step 10 in 2025 base pay. Locality pay adjustments then layer on top, with OPM recognizing 47 designated pay areas to account for regional cost-of-living differences.
The Benefits Advantage
BLS Employer Costs for Employee Compensation data reveals a significant gap in benefits spending:
- State and local government benefits average $25.59/hour — 38.5% of total compensation
- Private industry benefits average $14.01/hour — 30.1% of total compensation
Specific benefits that are standard or required in most public sector roles:
- Defined benefit pension plans — guaranteed monthly income in retirement based on years of service and salary
- FEHB health insurance — government contributes up to 72–75% of total premiums for federal workers
- 11 federal holidays per year (OPM-mandated)
- Separate sick and vacation accrual — not pooled into a single PTO bank
- Defined benefit plan access — 86% of state/local government workers have access to defined benefit plans vs. only 14% in private industry
Federal vs. State/Local: A Critical Distinction
These two categories tell very different stories. The President's Pay Agent's 2025 locality pay report found a 27.54% overall remaining pay disparity where federal employees trail non-federal workers. State and local workers, by contrast — when total compensation is counted — average $19.81 more per hour than private sector employees. State and local government workers tend to outpace private sector counterparts on total compensation; federal employees often trail on base salary.
What Is Private Sector Compensation?
Private sector positions span for-profit businesses across every industry — tech, finance, healthcare, manufacturing, retail, and beyond. Compensation here is driven by company revenue, market competition, individual performance, and employer discretion. That variability cuts both ways: higher ceiling potential, but less predictability.
Salary and Variable Pay
BLS data from March 2026 puts average private industry wages at $32.60/hour — lower than state/local government's $40.82/hour, but with significantly more upside in competitive fields. The private sector's real compensation advantage often shows up in variable pay:
- 50% of private industry workers have access to nonproduction bonuses vs. 38% in state/local government
- End-of-year bonuses averaged $2,503 in 2024, per WorldatWork
- Performance bonuses, commissions, and profit-sharing structures can dramatically boost total earnings beyond base salary
Benefits: More Variable, Still Substantial
Private sector benefits are less standardized, but many employers offer robust packages:
- 401(k) plans — 50% of plans provide matching contributions; 48% immediately vest employees in employer matching
- Health insurance with coverage levels that vary by employer
- Flexible PTO, remote work, and hybrid arrangements — 60% of employers offered hybrid work in 2025 (SHRM)
- Equity compensation and stock options in certain industries
The challenge isn't the benefits themselves — it's that employees often can't see them. According to EBRI's 2025 Workplace Wellness Survey, workers believe benefits represent just 16% of their total compensation on average, while the actual figure for private industry is 30%.
That perception gap is where private employers lose good people unnecessarily.
Closing the Perception Gap
This is where tools like COMPackage's total compensation statement software make a practical difference. The platform lets private employers itemize and display over 80 benefit categories — health and dental premiums, 401(k) contributions, disability coverage, employer-paid taxes, paid leave value, and non-cash perks like company phones, parking, and staff lunches.
Key features that help close the gap:
- Bulk Employee LOADER processes an entire census in under 90 minutes via Excel import
- Free report regeneration throughout the year at no additional cost
- Personalized reports showing only the benefits each employee actually receives
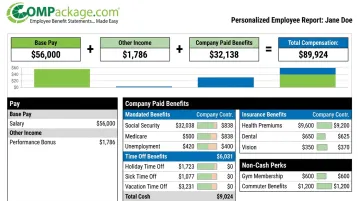
When employees see that total compensation runs 35–52% above base salary, the disconnect between perceived and actual value disappears — and so does the incentive to leave for a role that only appears to pay more.
Public vs. Private Sector Compensation: Which Is Better?
There's no universal answer. The better sector depends on what dimensions of compensation matter most to the person asking. Here's how the data breaks down by situation.
For Employees: It Depends on Your Priorities
Choose public sector if you prioritize:
- Guaranteed retirement income (defined benefit pensions)
- Stable, comprehensive family health coverage
- Job security during economic downturns — federal quit rates run 0.7 vs. 2.1 for private industry (BLS JOLTS, May 2026)
- Predictable career progression without performance pressure
Choose private sector if you prioritize:
- Higher income ceiling, particularly in tech, finance, or consulting
- Merit-based rewards and faster advancement
- Flexible work arrangements and benefits customization
- Equity upside or performance-based windfalls
Education Level Changes the Math
CBO's 2024 analysis of federal vs. private sector compensation shows a clear pattern by education:
| Education Level | Federal Wages vs. Private | Federal Benefits vs. Private | Federal Total Comp vs. Private |
|---|---|---|---|
| High school or less | +17% higher | +88% higher | +40% higher |
| Some college | +2% higher | +66% higher | +21% higher |
| Bachelor's degree | -10% lower | +44% higher | +5% higher |
| Master's degree | -14% lower | +17% higher | -4% lower |
| Professional/doctorate | -29% lower | Roughly equal | -22% lower |
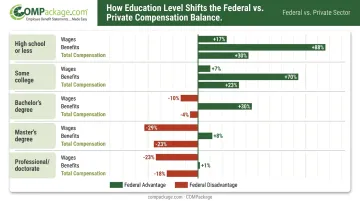
Workers with lower levels of formal education generally fare better in the public sector. Highly credentialed professionals in specialized fields almost universally earn more in the private sector — especially when variable pay is included.
For Private Employers: It's a Perception Problem
That education-level breakdown points to something private employers often overlook. Private sector base salaries frequently exceed federal pay at most credential levels — but employees who only see their paycheck, not their full compensation picture, are more likely to view government roles as the better deal. The gap is visibility, not substance.
Private employers can close that gap with four steps:
- Audit your total compensation package — salary, health premiums, retirement contributions, paid leave value, and non-cash perks
- Quantify everything — including items like parking, cell phone reimbursements, and employer-paid taxes
- Make it visible — provide employees with a comprehensive total compensation statement that shows what they're actually earning
- Repeat it regularly — not just at hire, but at reviews, during open enrollment, and when raises are given
A $75,000 salary paired with $25,000+ in benefits and employer contributions tells a very different story than a paycheck stub alone. Total compensation statement software — like COMPackage — exists precisely to make that full picture visible to every employee, not just the ones who ask.
Frequently Asked Questions
Who pays more: public sector or private sector?
It depends on which government level and which elements you're measuring. State and local government workers average $66.41/hour in total compensation vs. $46.60 in private industry — largely due to richer benefits. Federal employees, however, earn roughly 10% less in wages than comparable private sector workers.
What is considered public sector vs. private sector?
Public sector includes all government-funded positions at federal, state, and local levels — teachers, police officers, federal agents, social workers. Private sector covers positions at for-profit or privately funded organizations not affiliated with government.
What are the four basic types of compensation?
Direct compensation (base salary, wages, bonuses, commissions), indirect compensation (benefits like health insurance and retirement plans), non-financial compensation (flexible work, recognition, career development), and total compensation — the complete combination of all three.
What is a GS-15 equivalent to in the private sector?
GS-15 generally corresponds to senior director or VP-level roles in the private sector. Private sector compensation at that level typically exceeds GS-15 pay significantly — BLS data shows median chief executive wages at $206,420 and general operations managers at $102,950, with bonuses and equity adding further on top.
Do public sector employees get better benefits than private sector employees?
Generally, yes. Public sector benefits — particularly defined benefit pensions, standardized health coverage, and guaranteed paid leave — are more robust and consistent than private sector equivalents. BLS data shows government benefits represent 38.5% of total compensation vs. 30.1% in private industry.
How can private employers compete with public sector compensation?
Audit your full total compensation package — salary, benefits, retirement contributions, paid leave, and non-cash perks — then make sure employees can actually see it all. Tools like COMPackage display over 80 benefit categories in a clear, personalized statement so employees understand the full value of what they're earning.