That gap matters. In March 2026, private-industry employers spent an average of $46.60 per employee hour in total compensation, with wages making up 69.9% and benefits accounting for the remaining 30.1%, according to the Bureau of Labor Statistics' Employer Costs for Employee Compensation report. That means for every dollar an employee sees in wages, employers are often spending significantly more behind the scenes.
So when a Total Compensation Report lands in an employee's inbox for the first time, confusion is common. The numbers look bigger than a paycheck. The line items are unfamiliar. And it's not always clear whether this document replaces a pay stub or supplements it.
This guide breaks down what these reports actually mean, the components that make them up, how to read one line by line, and a worked example using real report structure.
Key Takeaways
- Total compensation includes wages plus the dollar value of every benefit an employer provides.
- Health insurance, retirement matching, and payroll taxes often add 30-50% on top of base salary.
- Separate dollar-valued benefits from non-quantifiable perks when you read your report.
- Clear total compensation communication boosts benefits satisfaction and employee engagement.
What Is a Total Compensation Report?
A Total Compensation Report is a document that itemizes the complete value an employer provides to an employee. It combines wages, bonuses, and commissions with the dollar value of benefits, insurance, retirement contributions, paid time off, and employer-paid taxes into one comprehensive figure.
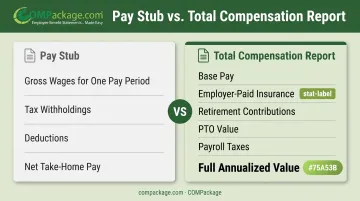
This is not the same as a pay stub. A pay stub shows cash wages for a single pay period, minus deductions, resulting in take-home pay. A Total Compensation Report shows the full annualized value of employment, including costs the employee never sees withdrawn from their own paycheck.
Who typically issues these reports?
HR and benefits teams generate Total Compensation Reports using dedicated statement software, often at these points:
- Annual performance reviews, to show the full value behind a raise or bonus decision
- Year-end reporting, summarizing benefits received throughout the year
- Recruitment and offer discussions, to demonstrate the complete value of a job offer
- Pro forma projections, estimating next year's package from prior-year data
The purpose is simple: show employees the "hidden paycheck" of benefits they rarely calculate on their own. Benefits already represent roughly 30% of total compensation nationally. Employers who never explain that figure leave a large share of the package invisible.
Key Components That Make Up Your Total Compensation
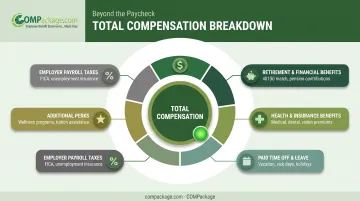
A complete report breaks compensation into distinct categories. Each category carries a different dollar impact, and several of them surprise employees the first time they see the numbers.
Direct Compensation
This is the cash portion employees already understand:
- Base salary or hourly wages
- Overtime pay
- Bonuses and incentives
- Commissions
Retirement and Financial Benefits
Employer contributions toward long-term financial security, including:
- 401(k) or retirement plan matching (commonly 3% to 6% of salary, depending on the employer)
- HSA or FSA employer contributions
- Stock options or profit-sharing, where offered
Health and Insurance Benefits
This is frequently the largest hidden-value line item on the entire report. In 2025, average annual premiums reached $9,325 for single coverage and $26,993 for family coverage, according to KFF's 2025 Employer Health Benefits Survey.
Employers typically cover a substantial share of that premium. Reports also include dental, vision, life, and disability coverage.
Paid Time Off and Leave
Vacation, sick leave, holidays, and parental leave all carry real dollar value. Reports convert this by multiplying accrued hours by hourly pay rate. For example, a $40,000 salary with 80 hours of accrued PTO translates to roughly $1,538 in time-off value alone.
Additional Perks and Non-Quantifiable Benefits
Some benefits don't come with a clean dollar figure but still add value:
- Professional development and training
- Wellness programs
- Remote work flexibility
- Cell phone or tech stipends
- Employee discounts
Platforms like COMPackage support over 80 preprogrammed benefit categories, plus unlimited custom entries, so employers can list these perks even when no monetary value applies.
Employer Payroll Tax Contributions
Most employees never realize their employer is paying taxes on their behalf, separate from what's withheld from their own paycheck:
- Social Security: 6.2% of wages up to the annual wage base
- Medicare: 1.45%, with no wage cap
- Federal and state unemployment insurance
These employer-only contributions typically show up as one of the more surprising line items on a first-time report.
How to Read Your Total Compensation Report: A Step-by-Step Walkthrough
A Total Compensation Report is easier to read when you work through it in a set order.
- Confirm your gross base pay. This figure sits at the top of the report and should match your employment agreement, before any deductions.
- Add up monetary benefit contributions. Insurance premiums and retirement match dollars typically appear together in a company-paid benefits section.
- Calculate time-off value. Multiply accrued vacation, sick, and holiday hours by your hourly rate if the report doesn't already do this for you.
- Review non-monetary perks separately. Remote flexibility or wellness access won't carry a dollar figure, but don't dismiss them as filler.
- Study any percentage breakdown. Many reports show company-paid benefits as a percentage of base pay. In one sample COMPackage report, benefits equaled 54% of base pay for an employee earning $40,000.
Common mistakes to avoid:
- Confusing gross pay with net take-home pay
- Overlooking employer-only tax contributions because they never touch your bank account
- Assuming non-quantifiable perks don't matter just because they lack a dollar sign
Clear report design helps you avoid those mistakes. COMPackage templates use color coding to separate employer contributions from employee contributions, so you can see where the extra value actually comes from.
Real-World Example: Sample Total Compensation Breakdown
Here's a sample structure based on an actual COMPackage employee report:
| Component | Amount |
|---|---|
| Base Pay | $40,000 |
| Additional Cash Benefits | $2,200 |
| Company-Paid Benefits (insurance, retirement, PTO, taxes) | $19,276 |
| Total Compensation | $61,476 |
In this example, company-paid benefits alone equal about 48% of base pay. Put differently, this employee's actual compensation is 53.7% higher than their base salary suggests.
This tracks with national patterns. BLS data shows benefits run roughly 43% on top of wages at the aggregate level (BLS ECEC), so a bump in this range isn't unusual.
A second sample, for a customer service role, shows a larger benefits uplift—driven mostly by richer insurance and retirement contributions:
| Component | Amount |
|---|---|
| Base Pay | $56,000 |
| Additional Cash Benefits | $1,786 |
| Company-Paid Benefits | $32,138 |
| Total Compensation | $89,924 |
The takeaway: actual figures vary widely by industry, role, and location. If you want your real numbers, ask HR for your personalized report rather than relying on averages.
Why This Report Matters: Benefits for Employees and Employers
For employees, a Total Compensation Report turns a fuzzy benefits package into numbers you can use.
- Job comparisons get clearer. A slightly lower base salary with stronger benefits might beat a higher salary with thin coverage.
- Appreciation increases. Seeing $19,000+ in employer-paid benefits changes how people think about their job.
- Financial planning improves. Knowing your real total compensation helps with budgeting, retirement planning, and negotiating.
For employers, the payoff shows up in engagement. WTW found that 84% of employees felt well informed about their benefits in 2025, up from 77% in 2024 (WTW, 2025).
Satisfaction still dropped to 61% over that same period. Information alone isn't enough—employees need to see and understand the value, not file away a benefits packet they never open.
This is where many small and mid-sized businesses run into a wall. Building personalized reports for an entire employee census by hand takes days. Hiring an outside compensation consultant can run into the tens of thousands of dollars.
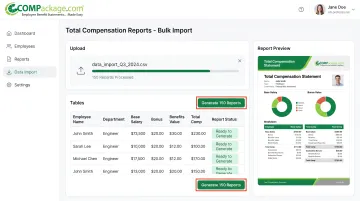
Self-service platforms have changed that math. COMPackage, for example, lets HR teams generate accurate, branded reports for their entire staff using bulk data import, without consultant fees. Pricing scales with company size, starting at $149 per year for teams of five and topping out at $2,999 for unlimited employees—well under a dollar per employee for larger organizations.
Frequently Asked Questions
What is a total compensation report?
A total compensation report shows the full value of employment: base wages plus the dollar value of all benefits, not just take-home pay. It reveals employer-covered costs employees typically never see on a paycheck.
Can you give me an example of total compensation?
Yes. One sample report shows a $40,000 base salary plus $2,200 in additional cash benefits and $19,276 in company-paid benefits, for $61,476 in total compensation. See the Real-World Example section above for the full line-item breakdown.
How often should companies provide total compensation reports?
Most employers issue them annually, often at year-end, during open enrollment, or as part of onboarding. Some companies also generate updated versions during performance reviews.
What's the difference between total compensation and base salary?
Base salary is only the cash wage you receive. Total compensation adds employer-paid benefits, payroll taxes, and perks on top of that wage, often raising the real package value by a wide margin.
Are employers required by law to provide total compensation reports?
No. The Department of Labor confirms the FLSA doesn't even require pay stubs, let alone total compensation statements. These reports are a voluntary best practice, not a legal mandate.
How can employers create total compensation reports for their staff?
HR teams can use self-service software like COMPackage to build reports in-house. With bulk data import tools, an entire employee census can be processed in under 90 minutes, no consultant required.