According to Payscale's 2025 Fair Pay Impact Report, 47% of employees paid above market rate still believe they're underpaid—and those employees are 45% more likely to start looking for a new job. That's not a compensation problem. It's a communication problem.
This guide is for business owners and HR decision-makers who want to put hard numbers behind compensation management software. We'll cover the hidden costs of poor compensation management, the key ROI drivers, a step-by-step calculation framework, and how to build a business case that wins budget approval.
Key Takeaways
- Nearly half of above-market employees think they're underpaid—the fix is transparency, not raises
- Employee replacement costs range from 50%–200% of annual salary, making turnover the largest ROI lever
- Pay transparency is now a compliance requirement across multiple states, raising compliance risk for employers
- The standard ROI formula is (Total Benefits − Total Costs) ÷ Total Costs × 100
- Small businesses often see stronger relative ROI than large enterprises per employee saved
Why Measuring Compensation Software ROI Matters More in 2026
The Regulatory Pressure Is Real
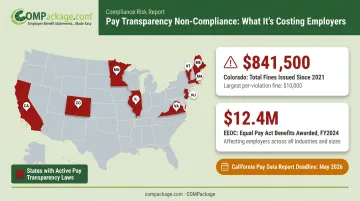
2026 is a pressure point for compensation management. Multiple states enacted or expanded pay transparency requirements in 2025–2026:
- Illinois — 15+ employees
- Minnesota — 30+ employees
- New Jersey — 10+ employees
- Vermont — 5+ employees
- Massachusetts, Maine, and Virginia — active requirements in effect
- California — pay data reports for 100+ employee firms due May 13, 2026
Colorado has recorded 2,803 pay-transparency complaints since 2021, resulting in $841,500 in total fines. The EEOC reported $12.4 million in Equal Pay Act monetary benefits in FY 2024 alone. For businesses without systematic compensation tracking, that's real financial exposure, often far exceeding the cost of annual software.
The Budget Justification Problem
HR technology competes directly against revenue-generating investments for limited budget. Without a concrete ROI case, compensation software gets deprioritized in favor of tools with more obvious financial returns.
For small and mid-sized businesses (5–500 employees), every dollar faces more scrutiny than at large enterprises. The burden of proof is higher, but so is the potential return.
What Decision-Makers Want to See in 2026
ROI expectations have shifted. Cost savings from automation aren't enough anymore. Budget influencers now want to see:
- Retention lift — reduction in preventable voluntary turnover
- Recruiting efficiency — improved offer acceptance rates
- Engagement improvements — employees who understand and value their total package
- Compliance risk reduction — defensible compensation records
Gallup's updated 2026 research shows 42% of voluntary turnover is preventable, with additional compensation or benefits cited in 30% of those cases. For most HR teams, that's the clearest starting point for building a compensation software ROI case.
The Hidden Costs of Poor Compensation Management
The Invisible Turnover Trigger
The most expensive problem isn't paying below market—it's failing to communicate that you're paying at or above market. Payscale's research found that 51% of employees who believed they were underpaid were actually paid at or above market rate. Employees at organizations with low pay transparency were 183% more likely to seek new employment than those at transparent organizations.
This is the perception gap. It's entirely preventable with better communication.
The True Cost of Turnover
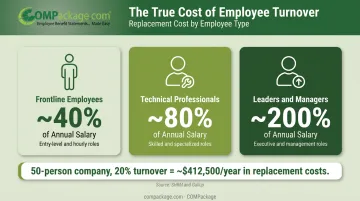
Replacement costs are higher than most managers expect. According to SHRM's research, the range is 50%–200% of annual salary depending on role level. Gallup breaks it down further:
| Employee Type | Estimated Replacement Cost |
|---|---|
| Frontline employees | ~40% of annual salary |
| Technical professionals | ~80% of annual salary |
| Leaders and managers | ~200% of annual salary |
A 50-person company with an average salary of $55,000 and a 20% annual turnover rate loses 10 employees per year. At a conservative 75% replacement cost, that's roughly $412,500 in annual turnover expense—before accounting for lost productivity and institutional knowledge.
Administrative Inefficiency
HR teams managing compensation through spreadsheets and email chains spend significant time on tasks that create no strategic value. Building individual pay summaries, updating benefit values manually, and fielding pay-related inquiries consume hours that could go toward workforce planning, benefits strategy, or employee development.
Payscale notes that manual compensation survey management alone can waste weeks or months of HR time through data collection, job matching, and entry—and that's just one phase of a full compensation cycle.
Compliance Exposure
Companies without systematic compensation tracking face growing legal risk from:
- State-level equal pay audits
- Wage reporting errors
- Job posting disclosure violations
- Pay equity misclassification
A single compliance incident can easily exceed the total annual cost of a compensation software subscription. Systematic, auditable compensation records reduce that exposure.
Recruiting Losses
Candidates who don't understand the full value of an offer may decline it—or accept a competing offer with a higher base salary, not realizing that the total package is actually less. SHRM reports that average cost per hire is nearly $4,700, with total hiring costs potentially reaching 3–4 times the position's salary when all hard and soft costs are included. Losing a candidate who could have been won with better offer communication is a direct, avoidable cost.
Taken together, these costs—turnover, administrative drag, compliance exposure, and recruiting losses—represent the true price of poor compensation communication. Measuring the ROI of compensation software starts with understanding what you're currently spending on each of them.
Key ROI Drivers: What Compensation Management Software Actually Delivers
Turnover Reduction Through Total Compensation Transparency
The single most impactful ROI driver is reducing avoidable turnover through the perception gap.
When an employee earning $60,000 in base salary receives a total compensation statement, they may see that their employer actually contributes $80,000+ when health insurance premiums, employer 401(k) match, PTO value, and other benefits are included. That $20,000 gap is invisible without a formal statement, and it's a significant retention risk.
Payscale's research shows employees at high-transparency organizations are 59% less likely to leave. Critically, actual market pay position was not statistically significant for job-seeking behavior in Payscale's analysis. Perceived fair pay was the stronger predictor. That means better communication can reduce turnover risk without changing compensation at all.
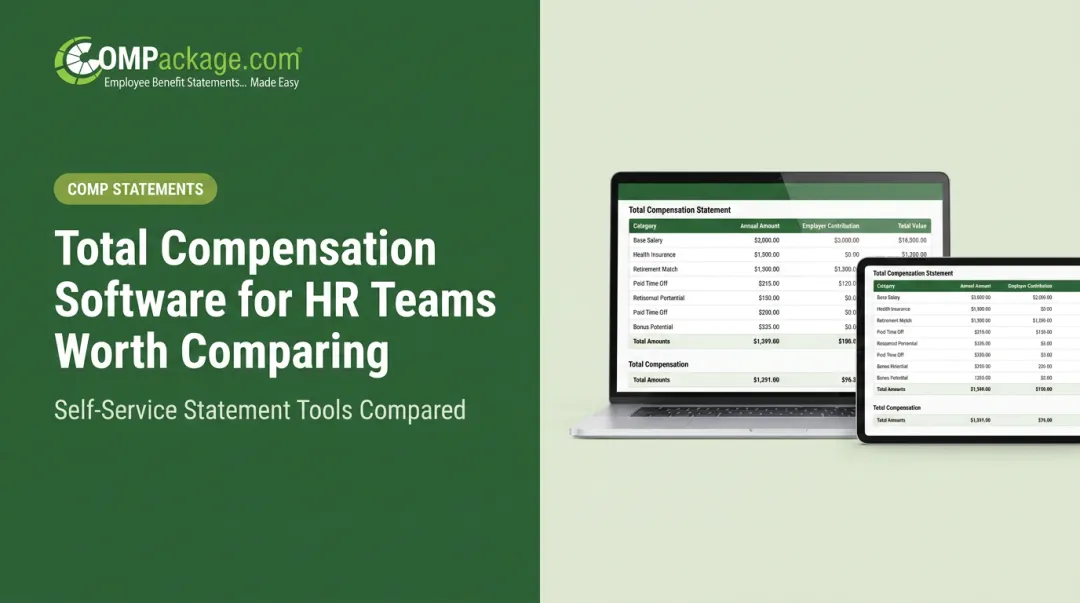
COMPackage is built around exactly this function. It generates self-service total compensation statements showing every element of an employee's package in a single, visually clear document: base salary, health insurance, employer retirement contributions, PTO, bonuses, and over 80 other benefit and perk categories.
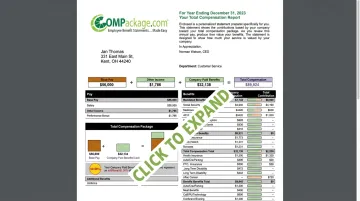
Only the benefits relevant to each employee appear on their individual report, keeping it personalized rather than generic.
Administrative Efficiency and Accuracy Gains
Automation replaces the most time-consuming manual compensation tasks:
- Building individual pay summaries for every employee
- Updating benefit values when costs change mid-year
- Generating reports across an entire workforce
- Responding to pay-related HR inquiries
COMPackage's Employee LOADER allows bulk data import from Excel, enabling HR teams to process reports for an entire employee census within hours rather than days.
The platform's auto-calculators reduce manual entry time for government benefits, 401(k) contributions, time-off valuation, and insurance calculations, cutting both hours spent and error frequency.
Error reduction carries its own ROI. Manual compensation processes create calculation mistakes and outdated benefit values that erode employee trust. When errors surface around pay or benefits, the credibility cost compounds across the entire workforce, not just the affected employee.
Recruiting and Offer Acceptance Advantage
That same internal efficiency advantage extends to hiring. Gallup found that 64% of employees cite a significant increase in income or benefits as very important when considering a new job. A compensation statement flips that dynamic at the offer stage, showing candidates the complete value of what they're being offered rather than just the base salary line.
A $65,000 offer with strong benefits, retirement matching, and generous PTO may represent $85,000+ in total compensation. Presenting that number clearly gives hiring managers a concrete edge:
- Anchors candidate expectations to total value, not just base salary
- Differentiates offers from competitors showing only salary figures
- Reduces offer negotiation friction when full package value is visible upfront
How to Calculate the ROI of Your Compensation Management Software
Step 1: Establish Your Baseline Metrics
Accurate ROI calculation requires documenting current-state numbers before implementation. Collect:
- Annual employee turnover rate (%)
- Average cost to replace one employee (recruiting + onboarding + training + lost productivity)
- Monthly HR hours spent on compensation-related tasks
- Frequency and cost of compensation errors or corrections
- Current offer acceptance rate for new hires
Without baseline data, you can't measure improvement. Even rough estimates are more useful than no data.
Step 2: Quantify Your Expected Benefits
Work through each benefit category:
Turnover savings — your largest ROI driver: (Current turnover % − projected post-software turnover %) × number of employees × average replacement cost per employee
Example: Reducing turnover from 20% to 16% at a 50-person company with $55,000 average salary and 75% replacement cost = 2 fewer departures × $41,250 = $82,500 saved annually
Time savings — compensation admin hours recaptured: (Hours saved per month on compensation tasks) × (HR hourly rate) × 12
Example: 8 hours/month saved at $35/hour = $3,360 annually
Error reduction — cost of mistakes avoided: (Average monthly compensation errors) × (average hours to resolve) × (HR hourly rate) × 12
Recruiting advantage — fewer re-opened roles: Estimate improvement in offer acceptance rate × reduction in re-recruiting costs per unfilled role
Step 3: Apply the ROI Formula
ROI (%) = (Total Annual Benefits − Total Annual Software Cost) ÷ Total Annual Software Cost × 100
To illustrate with realistic but fictional numbers for a 50-person company (these are illustrative only):
| Benefit Category | Estimated Annual Value |
|---|---|
| Turnover reduction (2 fewer departures) | $82,500 |
| HR time savings | $3,360 |
| Error reduction | $1,200 |
| Total Benefits | $87,060 |
| Software cost (annual) | $599 |
| ROI | ~14,400% |
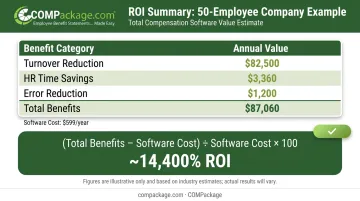
The numbers above use mid-range software pricing. For companies on entry-level plans — some starting under $200/year — the ROI climbs even higher. Most small businesses reach payback within the first quarter of use.
Note: Always account for one-time setup time and any data preparation costs in your full cost calculation.
Building a Business Case: Presenting ROI to Stakeholders
ROI numbers alone don't win budget approvals. Each stakeholder needs to hear the case in terms they already care about:
- CFOs: Lead with payback period, hard cost savings, and break-even timeline. Turnover cost reduction and HR time savings translate directly to dollars.
- HR leaders: Focus on retention metrics, engagement scores, and compliance risk reduction. Show the direct link between compensation transparency and measurable turnover improvement.
- CEOs: Frame total compensation communication as a recruiting differentiator—one that improves offer acceptance rates without increasing compensation budgets.
Tangible vs. Intangible Benefits
Separate your benefits into two categories when presenting:
- Tangible: Turnover cost savings, HR hours saved per compensation cycle
- Tangible: Error correction costs avoided, compliance penalty risk reduction
- Intangible: Employee trust, employer brand perception, morale improvements—real but harder to quantify
Present intangible benefits as supporting evidence, not the core financial argument. They add credibility to your numbers without carrying the weight of the business case.
Tracking ROI After Implementation
Turn the ROI calculation into a continuous measurement tool by tracking these metrics quarterly:
- Employee turnover rate
- Offer acceptance rate for new hires
- HR hours per compensation cycle
- Employee satisfaction scores on compensation clarity
- Compliance incident frequency
Frequently Asked Questions
What is the ROI of HR software?
HR software ROI measures the financial return from improved people-management processes relative to what the software costs. For compensation management, that return comes from reduced turnover, administrative time savings, and compliance risk reduction—with the exact figure varying by company size and baseline inefficiencies.
What's a good ROI on compensation management software?
HRSoft published a 150%–300% ROI range for enterprise compensation management implementations. For small and mid-sized businesses, the relative return is often higher because each prevented turnover represents a larger proportional cost. Even a modest reduction in voluntary departures can justify the investment within the first year.
How do you calculate the ROI of compensation management software?
Use: ROI (%) = (Total Benefits − Total Costs) ÷ Total Costs × 100. Benefits include turnover cost savings, time savings, and error reduction. Costs include subscription fees, setup time, and training. Document your baseline metrics first—the calculation is only as useful as the numbers behind it.
How quickly can compensation management software pay for itself?
Most organizations achieve payback within 6–12 months. The timeline depends on company size, turnover rate, and how much of the compensation workflow is currently manual. Small businesses using affordable tools like COMPackage can see payback within weeks.
What metrics should HR teams track to measure compensation software ROI?
The five most important metrics: employee turnover rate, average cost per replacement hire, HR hours spent on compensation tasks per cycle, offer acceptance rate for new hires, and employee satisfaction scores related to pay and benefits understanding.
Can small businesses realistically see ROI from compensation management software?
Yes—often more so than large enterprises. Each lost employee at a small business represents a higher proportional disruption, and affordable self-service platforms keep the cost side manageable. Tools like COMPackage require no installation or IT support, so a 15-person company can start generating total compensation reports within hours of purchase.