Key Takeaways
- Benefits average 30.1% of total compensation for private-industry workers — money employees never see on a pay stub
- Employers contribute $7,885 for single health coverage and $20,143 for family coverage annually
- 69% of employees want more benefits information, but only 34% say they receive year-round communication
- Employees highly satisfied with benefits are 2.53x more likely to report high job satisfaction
- Total compensation statements show employees what they're actually earning — COMPackage makes generating them fast and affordable for businesses of any size
Why Employees Underestimate Their True Compensation
Ask most employees what they earn, and they'll quote their salary. That number is accurate — but it's incomplete.
According to the U.S. Bureau of Labor Statistics March 2026 data, benefits average $14.01 per hour for private-industry workers, representing 30.1% of total compensation. Yet this entire portion of what employers spend is invisible on a standard pay stub.
The result is predictable: employees mentally anchor to their salary and discount or ignore everything else. A worker earning $60,000 in base pay may be receiving closer to $85,000 in total compensation once health insurance, retirement contributions, paid leave, and other employer-paid benefits are counted. They don't feel underpaid — they genuinely don't know.
The Real Cost of the Perception Gap
This misperception has measurable consequences. According to Aflac's 2025 Workforce Report:
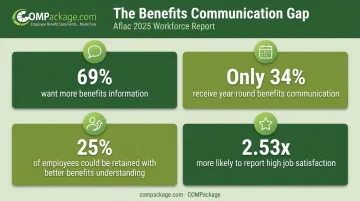
- 69% of employees want more benefits information from their employer
- Only 34% say they actually receive year-round benefits communication
- 25% say improved benefits — or better understanding of existing ones — could keep them in their current job
- Employees highly satisfied with their benefits are 2.53x more likely to report high job satisfaction overall
For most employers, the problem isn't the benefits package itself — it's that employees never fully grasp what it's worth. A company can invest heavily in health coverage, match 401(k) contributions generously, and provide strong PTO, and still lose employees to competitors who simply communicated their offer more clearly.
This gap hits smaller organizations hardest. Companies with 5 to 500 employees frequently invest in competitive benefits packages but lack dedicated HR infrastructure to communicate their value clearly. Employees at these firms often compare only salary figures when evaluating other offers, leaving the full picture invisible.
The fix is straightforward: make that full picture visible to employees in a format they can actually read, reference, and share.
The Four Major Categories of Employee Benefits
Before you can communicate benefits value, you need to know what you're working with. Benefits generally fall into four categories, each carrying real dollar weight that rarely shows up when employees think about what they earn.
Health and Medical Benefits
Employer-sponsored health insurance is the largest single benefit cost for most organizations. The 2025 KFF Employer Health Benefits Survey puts the numbers in sharp relief:
| Coverage Type | Total Annual Premium | Employee Pays | Employer Pays |
|---|---|---|---|
| Single | $9,325 | $1,440 (16%) | $7,885 (84%) |
| Family | $26,993 | $6,850 (26%) | $20,143 (74%) |
An employee with family coverage whose employer contributes over $20,000 annually — and who thinks of their "compensation" as their $65,000 salary — is missing nearly a third of what their employer actually spends on them. Health savings accounts (HSAs) and health reimbursement arrangements (HRAs) add further employer contributions that rarely register.
Retirement and Financial Benefits
401(k) matching is deferred compensation employees tend to undervalue precisely because it doesn't land in their bank account today. Vanguard's How America Saves 2025 report found that 96% of defined-contribution plans offered an employer contribution in 2024, with an average promised match of 4.6% of pay.
On a $60,000 salary, that's $2,760 per year. Compounded over a 20-year career, that figure represents tens of thousands of dollars in wealth employees rarely attribute to their employer.
Paid Time Off and Leave
PTO is the most emotionally resonant benefit category. Employees feel it every week, which makes it both high in perceived value and high in communication opportunity. BLS data shows private-industry workers average:
- 11 vacation days after one year, rising to 20 days after 20 years
- 7 sick days annually
- 8 paid holidays, covering 81% of private-industry workers
To assign a dollar value: divide annual salary by 260 working days to get a daily rate, then multiply by total paid days off. A $60,000-per-year employee receiving 25 days of combined PTO and holidays is receiving approximately $5,769 in paid leave value — a figure most would be surprised to see written down.
Supplemental and Ancillary Benefits
These include dental, vision, life insurance, disability insurance, employee assistance programs (EAPs), professional development stipends, and flexible work arrangements. BLS data shows significant variation by employer size:
| Benefit | Fewer than 100 workers | 100–499 workers | 500+ workers |
|---|---|---|---|
| Dental | 30% | 50% | 70% |
| Vision | 21% | 34% | 44% |
| Life insurance | 42% | 72% | 87% |
| Short-term disability | 31% | 53% | 68% |
Taken alone, each benefit appears modest. Together, they often add several thousand dollars in annual employer spend. Non-quantifiable benefits — remote work flexibility, advancement culture, schedule control — belong in this picture too, listed alongside dollar values so employees see the full scope of what the employment relationship actually delivers.
How to Calculate the Value of Your Employee Benefits
Tallying total compensation isn't complicated, but it requires pulling together numbers that usually live in separate systems. Here's the basic framework:
Start with base salary, then add:
- Health insurance — employer's annual premium contribution (single or family)
- Retirement — employer 401(k) match or profit-sharing dollar amount
- Life and disability insurance — annual employer-paid premiums
- PTO dollar equivalent — daily rate × total paid days off
- Legally required contributions — Social Security and Medicare employer share (~7.65% of wages), workers' compensation, unemployment insurance
- Other perks — professional development budgets, wellness stipends, commuter benefits, EAP
A straightforward example using round numbers:
| Component | Annual Value |
|---|---|
| Base salary | $56,000 |
| Employer health premium (family) | $20,143 |
| 401(k) match (4% of salary) | $2,240 |
| Life and disability insurance | $1,200 |
| PTO value (25 days) | $5,385 |
| Payroll taxes (employer share) | $4,284 |
| Additional benefits | $672 |
| Total compensation | $89,924 |
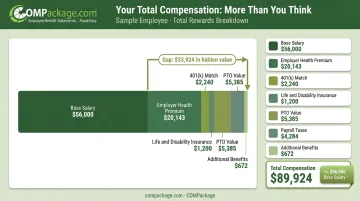
That employee thinks they earn $56,000. Their employer is investing nearly $90,000 in them annually.
Making This Practical at Scale
Running this calculation manually for one employee is manageable. For a workforce of 50, 200, or 500 people, each with different benefit elections, salary levels, and tenure, it becomes a significant project. COMPackage's self-service total compensation statement software addresses exactly this.
HR teams can input employee data, assign benefit values by category, and generate individualized reports for the entire workforce in a fraction of the time manual calculation would require.
The platform supports over 80 benefit category types, includes bulk import via Excel, and allows employers to include both quantifiable and non-quantifiable benefits on each personalized statement. Once all numbers live in one place, employers see their true per-employee investment — and each worker receives a personalized report showing exactly what their job is worth beyond the paycheck.
What Perks Do Employees Value Most?
Knowing what employees care about most helps employers prioritize where to focus their communication efforts. Aflac's 2025 survey identifies health benefits (38%) and paid time off (28%) as the top benefit factors in job-choice decisions, trailing only overall pay. These three — health coverage, retirement plans, and PTO — consistently lead benefits satisfaction rankings.
But "most valued" doesn't always mean "most understood." Employers should:
- Audit utilization rates — which benefits are employees actually using, and which are going unclaimed?
- Gather direct feedback through surveys or brief focus groups to reveal which benefits feel meaningful vs. invisible
- Spotlight underutilized benefits — if your EAP, tuition reimbursement, or wellness stipend has low usage, it likely needs a communication push, not elimination
Demographics matter, too. Aflac's research shows 41% of Gen Z employees are interested in student loan assistance and financial wellness programs, while experienced employees weigh retirement plans and healthcare more heavily. A single benefits communication sent identically to every employee is less effective than messages tailored to different workforce segments.
How to Communicate Employee Benefits Value Effectively
The numbers mean nothing if employees never see them. Communication is where most employers fall short — and where the biggest gains are available.
Start at Onboarding
New hires arrive with fresh attention and no anchored expectations. This is the ideal moment to present a complete total compensation breakdown alongside the salary offer.
When employees start their tenure knowing that a $60,000 salary represents $90,000 in total investment, they're far less likely to spend their first year comparing themselves to higher-salaried peers at other companies.
Make the Total Compensation Statement the Centerpiece
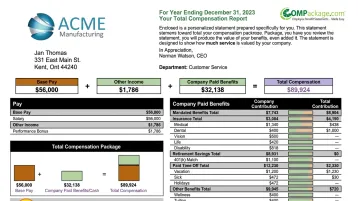
A personalized total compensation statement — showing base salary alongside the employer's dollar contribution toward every benefit — is the single most effective communication tool available. It makes the full picture concrete and undeniable.
COMPackage generates these statements for companies of all sizes without requiring outside consultants or lengthy processing timelines. Reports can include company logos, custom colors, and both quantifiable and non-quantifiable benefits, presenting a complete and visually compelling picture of each employee's package.
Build in Regular Communication Touchpoints
Benefits communication shouldn't be annual. Natural moments to resurface total compensation figures include:
- Open enrollment — when employees are already thinking about benefits
- Performance reviews — pair any salary adjustment with an updated total compensation picture
- Mid-year check-ins — especially if plan costs or employer contributions have changed
- After any raise or role change — update and redistribute the statement
Use Multiple Channels
Research consistently shows that most employees expect self-service benefits access online — yet a significant share still prefer talking to a real person during enrollment. Different employees absorb information differently, so layer your approach:
- Personalized PDF or printed reports for individual employees
- Manager-led conversations during review cycles
- Email summaries with key figures highlighted
- HR portal or intranet dashboards for self-service access
Differentiate Your Offer During Recruiting
Internal communication matters, but the same transparency that retains employees can also win candidates. Job seekers evaluating two similar salary offers rarely have visibility into the total compensation behind each one. An employer who proactively presents a full benefits breakdown during the offer process — not just a salary number — differentiates themselves before a single negotiation begins. When one offer includes $15,000 more in employer-paid benefits, that context can close the deal.
Frequently Asked Questions
How do you calculate the value of employee benefits?
Add the employer's annual cost for each benefit category — health insurance premiums, 401(k) contributions, life and disability insurance, PTO dollar equivalent, payroll tax contributions, and any additional perks — to base salary. Self-service tools like COMPackage simplify this process for entire workforces, generating individualized reports without manual calculation for each employee.
What perks do employees value most?
Healthcare coverage, retirement savings plans, and paid time off consistently rank as the most important benefits, followed by flexible work arrangements and mental health support. Preferences vary by life stage — younger employees often prioritize student loan assistance and professional development, while older employees weigh healthcare and retirement more heavily.
What are the four major types of employee benefits?
Most benefit packages fall into four categories:
- Health and medical — the largest employer cost, covering medical, dental, and vision
- Retirement and financial — 401(k) matching, profit-sharing, and related programs
- Paid time off and leave — vacation, holidays, sick time, and parental leave
- Supplemental benefits — life insurance, disability, EAP, and professional development
What is a total compensation statement and why does it matter?
A total compensation statement is a personalized document showing an employee's base salary alongside the employer's dollar contribution toward every benefit they receive. It makes the full value of compensation visible — and studies show that benefits satisfaction links directly to overall job satisfaction, with highly satisfied employees 2.53x more likely to report high job satisfaction overall.
How often should employers communicate benefits information?
At minimum annually, tied to open enrollment or performance reviews — with additional touchpoints at onboarding and after any salary or role change. Only 34% of employees report receiving year-round benefits communication, despite 69% wanting more, so most organizations have clear room to improve.