Introduction
Most employees have no idea what their employer actually spends on them. They see their paycheck and assume that's the full story — but for many workers, employer-paid benefits add 30% or more on top of base salary in additional economic value they never see or think about.
That gap is a retention problem waiting to happen. An employee earning $65,000 who feels underpaid might be one recruiter call away from leaving — even when their total compensation package is worth closer to $85,000 once you factor in health insurance, retirement contributions, paid time off, and other employer-paid costs.
An annual compensation report fixes that. It's a personalized, employee-facing document that shows the full value of what you actually provide — not just what appears on a paycheck stub.
This guide is for HR professionals, benefits managers, and business owners responsible for communicating compensation to employees. It covers what annual compensation reports are, what to include, how to build and distribute them efficiently, and which mistakes to avoid.
Key Takeaways
- Annual compensation reports combine base pay, benefits, bonuses, and employer-paid costs into one employee-facing total
- Benefits represent roughly 30–38% of total compensation for most U.S. workers, according to 2026 BLS data
- Effective reports are personalized to each employee, not based on company-wide averages
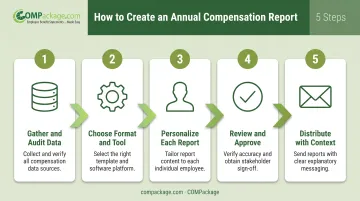
- Creating reports involves five steps: gather data, choose a format, personalize, review, and distribute with context
- "Annual compensation report" and "workers' compensation payroll report" are two completely different documents, a common source of confusion in HR
What Is an Annual Compensation Report?
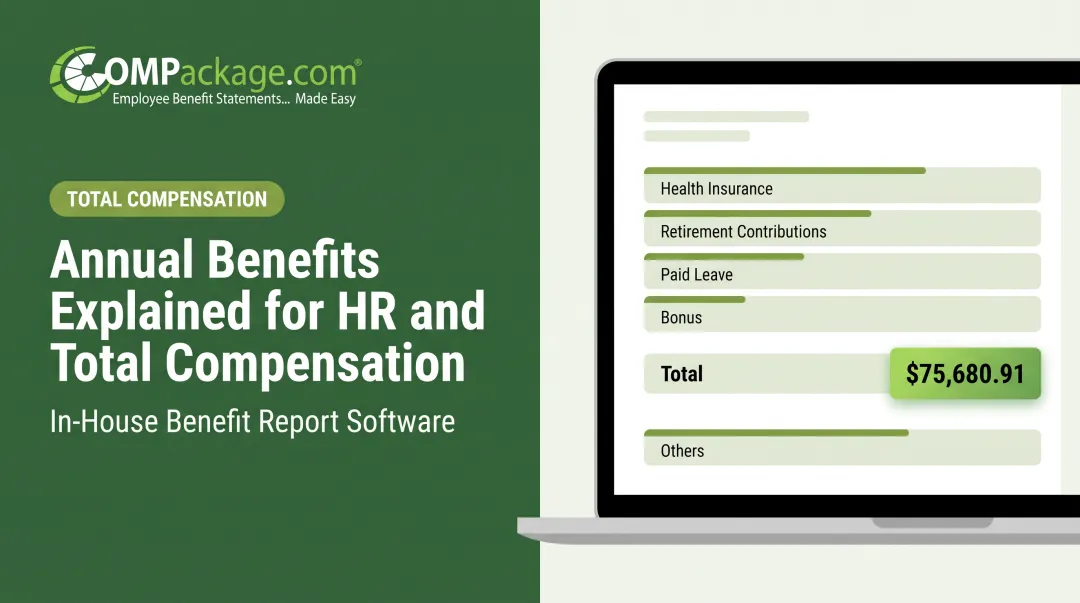
An annual compensation report — also called a total compensation statement — is a personalized, employee-facing summary of every form of compensation an employer provides. It typically covers:
- Base salary and bonuses
- Employer-paid insurance premiums
- Retirement contributions
- Dollar value of paid time off
- Supplemental benefits
All of this appears in one document, usually issued once per year.
The goal is straightforward: help employees understand the full economic value of their employment relationship, not just the number on their paycheck.
What It Is Not
HR teams regularly confuse three separate documents:
| Document | Purpose | Audience |
|---|---|---|
| Annual compensation report | Shows employees their total compensation value | Employee-facing communication |
| Workers' compensation payroll report | Validates insurance premiums after a policy year | Insurance auditors and carriers |
| Pay stub | Records a single pay period's earnings and deductions | Transactional, not a summary |
A workers' comp payroll audit is an insurance filing. An annual compensation report is an employee communication tool. They share similar-sounding names and nothing else.
Why HR Professionals Should Issue Annual Compensation Reports
Annual compensation reports make the full value of pay and benefits visible—not just base salary. That shift supports retention, recruiting, and clearer pay communication.
Benefits Employees Never See on a Paycheck
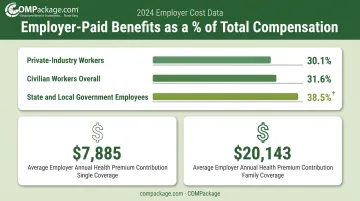
According to the Bureau of Labor Statistics' March 2026 Employer Cost data, employer-paid benefits represent:
- 30.1% of total compensation for private-industry workers
- 31.6% for civilian workers overall
- 38.5% for state and local government employees
That's roughly $1 in every $3 an employer spends on a worker that never shows up in a paycheck. Health insurance alone is a major driver. The KFF 2025 Employer Health Benefits Survey found average employer premium contributions of $7,885 for single coverage and $20,143 for family coverage annually.
Most employees have no idea their employer is paying those amounts on their behalf.
Retention and Engagement Impact
Pay dissatisfaction drives real attrition. Gallup research found that 42% of voluntary departures were considered preventable by the employees who left — and compensation and benefits accounted for 30% of the actions they said could have made them stay.
When employees can't see their total compensation, they compare base salaries. That's the only number they know. Annual compensation reports change the comparison point.
Edge in Recruiting
During the offer stage, a total compensation breakdown helps candidates evaluate what they're actually being offered — not just the base salary line. When your health benefits, 401(k) match, and PTO value are visible and quantified, an offer that looks average on paper often looks genuinely strong in full.
Compliance and Pay Transparency Pressure
No federal law requires private employers to issue annual compensation reports. Pay transparency rules are expanding quickly at the state level, though. As of 2025, California, Colorado, Illinois, Minnesota, New Jersey, and Massachusetts all have active pay-related transparency requirements. Proactive compensation communication is becoming a baseline HR expectation, not a differentiator.
What to Include in an Annual Compensation Report
A complete report covers both quantifiable dollar amounts and non-quantifiable perks. Here's a breakdown by category:
Direct Compensation
- Base salary or annualized hourly wages
- Overtime pay received during the year
- Performance bonuses, signing bonuses, and referral bonuses
- Commissions and profit-sharing distributions
Employer-Paid Insurance Benefits
- Health insurance premiums (employer's share, often $7,000–$20,000+ annually)
- Dental and vision insurance premiums
- Life insurance and disability insurance (short-term and long-term)
Retirement and Savings Contributions
- 401(k) or pension match amounts
- HSA or FSA employer contributions
- Any deferred compensation funded by the employer
Employer retirement contributions average around 4.8% of pay according to Fidelity's Q1 2025 retirement analysis — a meaningful number most employees don't track separately.
Paid Time Off — Quantified in Dollars
PTO is often the highest-impact line item employees never see expressed as money. Calculate it as daily rate × days allotted (vacation, sick leave, holidays, parental leave). For a $70,000 salary with 20 PTO days, that's roughly $5,385 in paid leave value.
Supplemental Employer-Paid Benefits
- Employee assistance programs (EAP)
- Tuition reimbursement and certification budgets
- Wellness stipends
- Transportation allowances, parking, or remote work stipends
- Company-provided cell phones or equipment
Non-Quantifiable Perks
Not everything has a dollar value, but it still belongs in the report. Include perks such as:
- Work-from-home or hybrid flexibility
- Professional development and learning budgets
- Mentorship programs
- Clear career growth paths
Listing these next to dollar-value items gives employees a fuller, more honest picture of why they chose this job over alternatives.
How to Create an Annual Compensation Report: Step-by-Step
Step 1: Gather and Audit Your Compensation Data
Pull accurate figures from payroll, benefits administration, and finance. Collect:
- Employer-paid insurance premiums (by plan type, individual vs. family)
- Retirement match rates and actual contributions per employee
- PTO accrual rates and balances
- Any bonuses or special payments made during the year
Verify everything before you generate reports. Errors erode employee trust faster than any benefit gap.
Step 2: Choose Your Format and Tool
You have three main options:
- Spreadsheets — functional for small teams, time-intensive at scale, and prone to formula errors
- HRIS platform exports — available if your system supports it, but often limited in customization
- Dedicated total compensation report software — built for this workflow, with less manual cleanup than spreadsheets for most HR teams
For teams of 5 to several thousand employees, tools like COMPackage generate personalized, branded reports in bulk from Excel imports. You get 80+ benefit categories, 12 auto-calculators, and no IT install—annual plans start at $149 for small teams.
Step 3: Personalize Each Report
Each report must show that employee's actual pay and benefits, not company-wide averages. Include:
- The specific health plan the employee is enrolled in (individual vs. family coverage)
- Their actual salary tier and bonus amounts
- Their personal PTO accrual and any special benefits that apply to them
Benefits the employee isn't enrolled in shouldn't appear on their report at all.
Step 4: Review and Approve
Before distributing anything, have compensation data reviewed by finance or a manager. If you operate in states with pay equity reporting requirements, add a compliance check here. One error in a distributed report is far more damaging than a short delay.
Step 5: Distribute with Context
A report sent without explanation is often ignored, misread, or forgotten. Deliver it through:
- A one-on-one conversation with the employee's manager
- A clear cover letter explaining what the report shows, why it was created, and how to read it
- An HR-led meeting, particularly for the first year you introduce this practice
Pair the numbers with a short conversation so employees understand the full value of their package.
Common Mistakes HR Professionals Should Avoid
Using company averages instead of employee-specific data. A report showing a $0 retirement match because the employee hasn't enrolled, or listing a health plan they opted out of, destroys the credibility of the entire document. Reports must reflect what each individual actually receives.
Confusing this with a workers' compensation payroll report. It happens more often than it should. The workers' comp annual payroll report is an insurance audit document. The annual compensation report is an employee communication tool. They serve different audiences and purposes.
Creating reports once and never updating them. Benefits costs change mid-year. Bonuses are paid outside the annual cycle. Employees move between benefit tiers. A report built on January data and handed out in December can do more harm than good. Update reports whenever compensation structures change, not only at annual review time.
Omitting non-salary benefits entirely. Some HR teams produce reports that show only base salary and one or two benefit lines. That document is a paycheck summary, not a total compensation statement. The value is in showing the full picture.
How Annual Compensation Reports Support Employee Retention
When employees see a total compensation summary showing their full employer investment, it reframes the conversation about whether they're being fairly paid.
Napa Valley Petroleum found fringe benefits added 35–50% on top of wages, a figure that changed how employees understood their pay. Bullard Manufacturing used COMPackage to show benefits adding 42–52% to annual compensation — a report they previously had no way to produce.
That visibility matters during the moments that count:
- Annual reviews: When both parties work from the same document, salary conversations become less adversarial
- Resignation conversations: When someone resigns over a competing offer, a total compensation report gives you concrete data for the discussion
- Recruiting: When candidates compare offers, a full-package breakdown is more persuasive than base salary alone

Organizations that tie compensation reports to the annual performance review cycle turn a one-time handout into an ongoing practice. Consistent distribution makes pay transparency part of your culture instead of a reactive response to turnover.
Conclusion
An annual compensation report is one of the most underutilized tools in HR. Everything it documents, from health insurance and retirement match to PTO value, your organization is already paying for. The only question is whether employees know about it.
The process works when reports are accurate, personalized, and delivered with context. A generic report, or one filled with errors, can undermine trust rather than build it. But done well, it turns existing spending into visible value.
Start with the right structure and tools so that producing and distributing reports becomes a repeatable annual process, not a project you scramble to complete once and never revisit.
Frequently Asked Questions
What is an example of annual compensation?
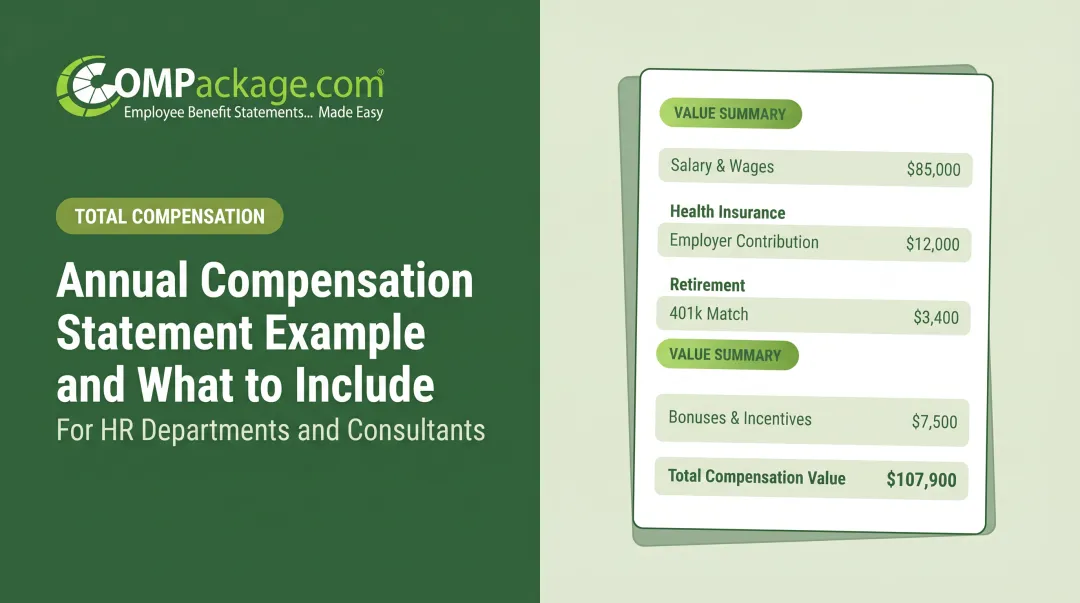
A $60,000 base salary plus $8,000 in health premiums, a $3,000 401(k) match, and $5,000 in PTO value equals about $76,000 in total annual compensation. That total covers all employer-provided value, not just take-home pay.
What is the difference between a compensation report and a total compensation statement?
Most HR teams use the terms interchangeably. A total compensation statement is the employee-facing document of full pay and benefits value; a "compensation report" can also mean broader organizational or market analysis. In practice, both usually mean the same communication tool.
What should be included in an annual compensation report?
Core components include base salary, bonuses, employer-paid insurance premiums, retirement contributions, the dollar value of PTO, and supplemental benefits like wellness stipends, tuition reimbursement, and EAP. Non-quantifiable perks such as remote work flexibility can be listed alongside dollar-value items.
How often should companies issue compensation reports to employees?
At minimum, once per year, ideally timed to the annual performance review cycle. Issue mid-year updates when significant changes occur, such as benefit renewals, off-cycle bonuses, or salary adjustments.
Can small businesses create annual compensation reports?
Yes. Businesses with as few as five employees can create professional compensation reports without an enterprise HR system. Self-service tools can generate personalized reports in-house in a few hours at a low annual cost.
How do annual compensation reports help reduce employee turnover?
Many employees compare only base salaries when weighing competing offers and miss the full value of their current package. A compensation report closes that gap, so people are less likely to leave for slightly higher base pay once they see what benefits and paid leave are worth.